Prioritizing Declining Content: A Decision-Support Model for Refresh Queues
Which specific, currently declining pages should a content team review first — and how much can search-signal data alone actually tell us?
Abstract
Content teams routinely have more pages than they have hours to review, and no reliable way to decide which stale, sliding page is worth fixing first. This project asks whether observable search signals — clicks, sessions, position, staleness — can rank a content portfolio by decline risk well enough to be useful. Using a 90-day trailing slice of anonymized search performance data across 32 clients, a grouped-by-client logistic regression was trained and, critically, audited for leakage: an initial version scored a suspicious 100% accuracy, which a leakage confession test traced to two features that were mathematically tied to the label itself. Once removed, the honest model reaches roughly 67% accuracy against a 62.8% base rate globally — modest — but the top of its ranked queue is meaningfully cleaner, at ~88% precision in the top 100 candidates. The result is not a prediction of what will happen to any single page, but a decision-support ranking: a shortlist a human reviewer can trust more than the top of an unranked list, with the biggest caveat being that the validation holdout happened to be dominated by one content type.
Introduction & Problem Statement
A content team manages far more pages than it can manually re-review on a regular cadence. Some pages are quietly declining in search visibility; most are fine. The team's real bottleneck isn't knowing that some pages decline — it's knowing which declining page to open first, given a finite number of reviewer-hours today.
The decision this work supports: which specific, currently declining pages should the content team review first? The action a human takes from it is to open the top-ranked page and decide, using the model's stated reason codes, whether to refresh it, consolidate it, or leave it alone. The cost of getting this wrong is concrete — if a low-value, seasonal, or effectively dead page reaches the top of the queue, a reviewer spends real hours on a page with little upside while a higher-value opportunity sits unreviewed further down the list.
This is a ranking and prioritization problem, not a causal one: nothing here claims that refreshing a page causes it to recover. The goal is a defensible shortlist, not a guarantee.
Data
The analysis draws on the FlyRank ML Internship warehouse, specifically the fact_content_daily_performance table, alongside a trailing-90-day anonymized content-performance slice used for modeling. The core modeling dataset covers 32 clients and three content types (keyword article, feedly article, comparison article), with each row representing one content item's performance over a defined window — report_date × client × content grain, confirmed at exactly one row per grain group with no duplication.
A separate exploratory month-slice of the warehouse (March 2026) was checked for scale and confirmed 9,841,378 rows in a single month across the full client base, consistent with the program's overall ~79 million row production search dataset.
What was excluded, and why
- Client and content identifiers (
client_id,content_id) are used only for grouping the train/test split — never as model features, and never surfaced here beyond anonymized/hashed form. trend_directionandtrend_pctare excluded from the feature set entirely: the target label is mathematically derived from them, so including them would hand the model the answer.- No client names, raw URLs, or verbatim search queries appear anywhere in this analysis or the underlying notebooks — a public-safety pass was run specifically for this before publishing.
- GA4 zero-fills were treated as missing, not zero. A blank/zero in analytics data here means "not measured," not "no engagement" — conflating the two would silently bias the model.
Data limits
Client history depth is uneven — some clients have far more historical tracking than others — so a single global calendar window cannot be assumed to mean the same thing for every client. The dataset used for modeling also has no report_date-style column, only a duration field (days_since_last_update); this means every split in this project is a grouped split (by client), not a genuinely time-aware, past-vs-future split. That distinction matters for how the results below should be read.
Methodology
Label and features
The target, is_declining_label, is defined as a page whose trailing trend percentage is negative. Features are restricted to signals that are knowable at the decision moment: trailing click, session, and engagement counts, average search position (with an explicit fix for the "0 means no data, not rank zero" gotcha), content age and staleness tier, and word count — each with missingness handled via explicit indicator flags rather than a blind fill-with-zero, to avoid injecting a false category signal.
Baseline
The baseline is a transparent rule: flag a page as needing a refresh if it hasn't been updated in 180+ days and its average search position has slipped outside the top 10, provided position data actually exists for it. This rule alone identified 63 actionable items in an exploratory 30,000-page slice, giving an early signal the lane was worth pursuing before any modeling began.
Validation design
The train/test split is grouped by client_id (an 80/20 GroupShuffleSplit) so that no single client's pages appear in both training and test data — this prevents the model from learning client-specific quirks and calling it generalization. A genuinely time-aware split was considered and explicitly rejected for this dataset, because the only duration-like field available (days_since_last_update) is not a calendar date, and splitting on it would silently mean splitting by freshness tier rather than by past-vs-future.
The leakage check that changed the result
impressions_last_30d and impressions_prev_30d were mechanically tied to how the label itself was computed, and their coefficients (−7.92 and +7.91) nearly cancelled — a textbook leakage signature.
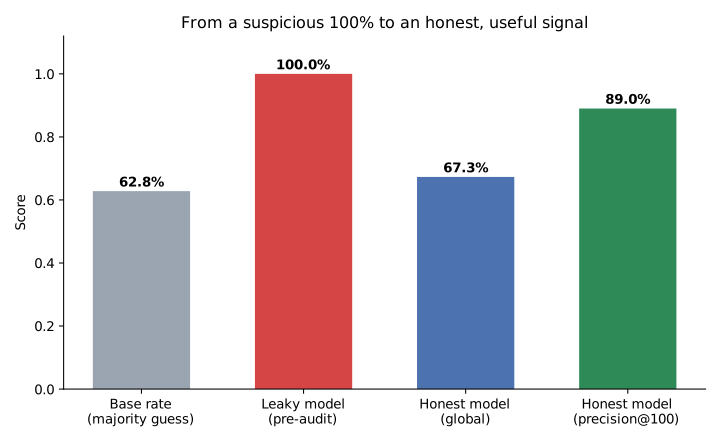
A second, quieter issue was also fixed: avg_position == 0 was being read by early features as a literal top rank, when the data dictionary defines it as "no data." Rows were flagged and imputed from valid-only values instead.
Leakage audit checklist (final feature set)
| Check | Result |
|---|---|
| Features strictly precede the label window | Mostly confirmed — two same-window click/session features are lower-risk but flagged, not assumed safe |
| No label-derived or sibling columns | Confirmed by the confession test (accuracy collapse) |
| No pre-existing product scores as features | Confirmed clean |
| Split grouped by repeating entity | Confirmed — grouped by client_id |
| Base rate reported alongside every metric | Confirmed — 62.8% throughout |
| Top feature importance sanity-checked | Confirmed — healthy, spread-out coefficients post-fix |
| Metrics cross-validated out-of-fold | Not done — single holdout only; named as a limitation |
Results
All numbers below are measured on the same held-out test split (6,163 rows) the rule baseline was also evaluated on.
| Metric | Rule baseline | Honest model |
|---|---|---|
| Precision | 0.611 | 0.714 |
| Recall | 0.463 | 0.798 |
| Accuracy | 0.478 | 0.672 |
| Base rate | 0.628 | |
The metric that actually matters for a ranked queue
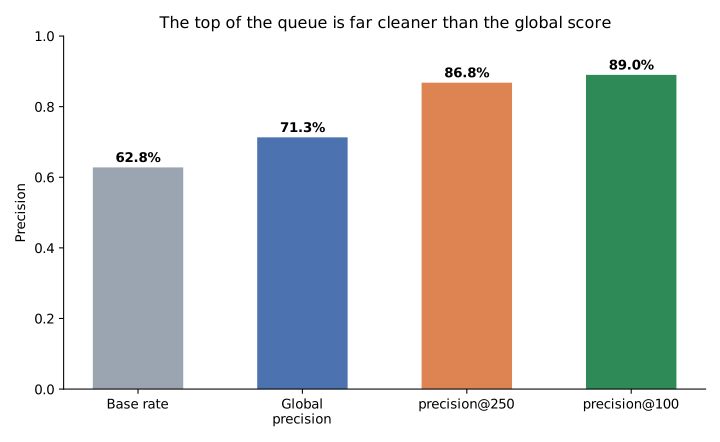
Global accuracy describes the whole test set, but this model is used top-down as a ranked queue — so precision@K (how clean the top of the list is) is the honest metric to report, not global accuracy alone.
What the model leans on
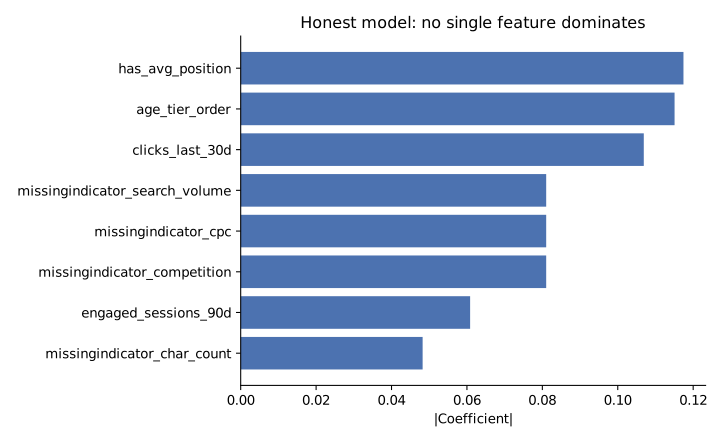
After the leakage fix, the top coefficients spread across several signals rather than one dominant feature — clicks_last_30d, age_tier_order, engaged_sessions_90d, clicks_90d, and the has_avg_position missingness flag are the leading drivers, none of them anywhere near as dominant as the leaked features were.
An important caveat found while building the queue
Limitations & Honest Framing
- Global precision is modest. At 0.714, it's meaningfully above the 62.8% base rate but far from a strong standalone predictor — the value is concentrated in the ranking, not in any single flagged item.
- No genuine time-based validation. The dataset used has no calendar date field, only a duration; this means the model cannot claim "this page will decline next month," only "this page currently resembles ones labeled declining in this dataset."
- Single train/test holdout, not cross-validated. The exact precision@K numbers would likely shift somewhat under a different random seed.
- Validated directly on one content type. Precision@K is demonstrated for keyword articles; feedly and comparison articles were in training but not independently confirmed in this holdout.
- Selection bias in prior program findings this project audited (not this model). Separate research claims reviewed during this internship — e.g. that refreshing aged pages produces large performance lifts — were found to rest on non-random editor selection of which pages got refreshed, meaning the reported lift mixes the refresh effect with the choosing effect. That distinction is discussed fully in the reproducibility notebooks linked below.
- This is decision support, not causal proof. Nothing here demonstrates that acting on the queue causes recovery — only that the ranking outperforms an unranked list and a simple rule baseline on this historical slice.
Ranked Recommendations
- Use the queue top-down, not as a flat list. Precision is highest in the first ~100–250 ranked items (~86–88%); treating rank 3,000 the same as rank 1 misuses the model.
- Route "no ranking data" items to a data-verification step, not the action queue. Roughly 1% of the held-out set had missing position data (
avg_positionwas 0/unmeasured) — these should never be treated as "ranked last," only as "unverifiable, check tracking first." - Re-validate before extending the queue to feedly or comparison articles. Because the current holdout happened to be keyword-article-heavy, teams should re-run validation with a stratified split before trusting precision@K figures for the other two content types.
- Never auto-publish or auto-edit from this queue. The model flags candidates for human review; a reviewer should sanity-check each reason code against context the model cannot see (seasonality, recent manual changes, paused campaigns).
- Monitor for the leakage signature reappearing. Periodically re-run the confession test on any new feature added to the pipeline — if one feature's coefficient suddenly dominates the way the removed impressions features did, that is the same failure mode resurfacing under a new name.
- Track base-rate drift as a retrain trigger. If the true share of declining content in a fresh sample moves more than ~5 points from 62.8%, the model's calibration is out of date.
Reproducibility
All analysis is reproducible from the public repository. Key notebooks, in the order this paper builds on them:
- w03_data_contract.ipynb — grain, time window, and field-by-field public-safety classification
- w04_baseline_score.ipynb — the rule baseline and its ranked queue
- w05_model.ipynb — the first (leaky) model and the suspicious 100% score
- w06_validation_audit.ipynb — the leakage confession test, the honest re-validation, and the claim rewrites this paper is built on
- w07_action_playbook.ipynb — the precision@K analysis, the ranked queue, and the no-go list
- capstone.ipynb — the synthesis notebook this paper mirrors section-by-section
Random seed 42 is fixed throughout. All notebooks run top-to-bottom from a fresh clone of the repository; data is pulled directly from the repo's public, anonymized CSV at run time rather than committed as a static artifact.
Acknowledgments & Data Credit
Built on the FlyRank ML Internship dataset — flyrank.ai.